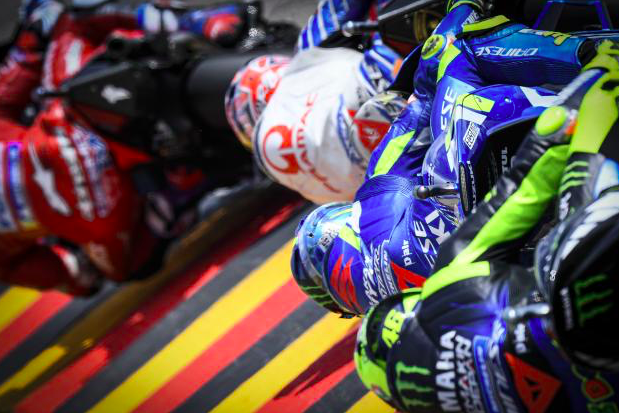
All rider photos sourced from MotoGP.com
“This is one of the most competitive seasons in recent MotoGP history!”
“Marquez is going to have some stiff competition next year!”
“This set of rookies may be the strongest yet!”
These are just a few statements that MotoGP fans heard numerous times throughout the 2019 season as riders pushed the limits and brought viewers one exhilarating race after another. A handful of riders spent the entire season in the limelight this season, making it easy to overlook the talent across the grid. As more seasoned riders begin to phase out and new riders exceed expectations, it is important to look at the series as a whole and recognize the group annual progression and range in talent across the grid.
Today we are going to analyze the fluctuation of range in Combined Index for every race over the past 3 years. These values represent the gap in performance from the top ranked rider to the last one to cross the checkered flag. This will allow us to see the shift in competition from one season to the next, taking into account all riders.
Below you will find 3 charts that track the ranges in Combined Index along with a trend line to represent the overall movement within the season. Because a smaller range represents a smaller gap between 1st and last, a negative trend line represents an improvement in group performance throughout the season as the range in indexes shrinks. On the contrary, a positive trend line represents a weaker group performance as the range increases throughout the season.
Each graph is accompanied by 2 very important rankings with 1 being the strongest and 3 being the weakest:
Average range value: The average range in Combined Index for a single year.
Precision value: The closeness of Combined Indexes from one race to the next (how close measurements of the same item are to each other).
Combined Index: A Speed Index handicapped by a Consistency Index – this index reflects historical performance
If you are unfamiliar with or need a refreshed on Grand Prix Scout’s unique indexing system, click here!
2017
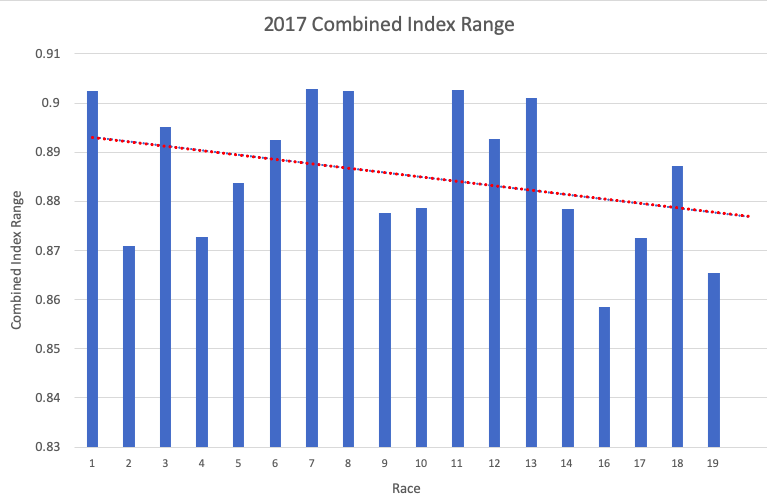
Average range rank: 3
Precision rank: 1
The negative trendline suggests an improvement in group performance as the second half of the season saw a smaller gap in Combined Index range. This means that the group improved as a single unit with little outliers which would be caused by one rider excelling at faster rate or one rider falling behind.
The 2017 season saw the least competitive average range out of the 3 years i.e. this year endured the largest gap from 1st to last place. Although the level of competitiveness lacked with a larger average range in Combined Index, 2017 holds the strongest precision, meaning that riders maintained consistent performances from one race to the next.
2018
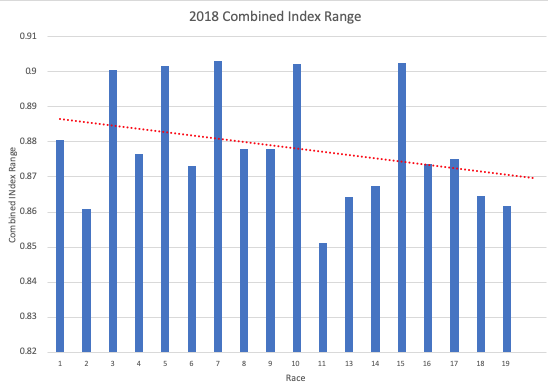
Average Range Rank: 1
Precision rank: 3
Similar to 2017, the negative trendline in 2018 suggests that riders from the back of the pack gradually closed in on those leading the way across the checkered flag. As the season progressed, the range in Combined Index lessened as the grid became a more even playing field.
The 2018 season stands as the season with the strongest average range meaning that it was actually the most competitive season when taking into account the entire grid. The range in Combined Indexes from the front to back remained low, suggesting that there were few, if not any, significant outliers (no one absolutely crushing it, no one completely left behind).
With that said, 2018 saw the weakest precision value, meaning that the group’s performance experienced great volatility from one race to the next. This is clearly displayed by the constant jump in horizontal bars in the 2018 graph.
2019
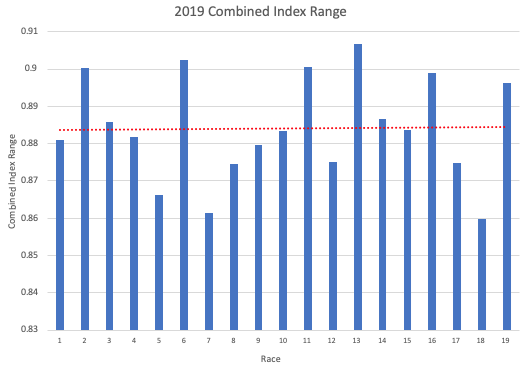
Average Range Rank: 2
Precision rank: 2
The 2019 season followed a different path compared to the 2 previous seasons as seen through the positive trendline. As the season progressed, the gap in Combined Index from the race leader (most commonly the machine, Marc Marquez) to the rider carrying up the rear gradually increased. While this is exciting on the surface, here lies the underlying issue – the MotoGP series experienced a significant shift in competition and as a result, the sport has become shaped around a slim handful of riders.
The average range value falls in the middle, just barely beating 2017 with the precision value also falling in the middle, just behind 2017. So what does this mean?
The 2019 season saw a competitive range in data with notable fluctuation from one race to the next. The grid as a whole did not improve as a unit as the positive trendline reflects the isolation of the front runners from the remaining pack.
What Can We Take Away From This?
Striving for a level playing field is crucial for the growth and future of the sport. The series will not prosper if 1-3 riders carry the weight on their shoulders. Talent must be promoted throughout the entire series to shed light on the uniqueness that lies within each rider and manufacturer.